stLearn
Preface
IMPORTANT
stLearn is a comprehensive analysis toolkit specifically designed for spatial transcriptomics data. By integrating three data types: spatial distance (Spatial distance), tissue morphology (tissue Morphology), and gene expression (gene Expression) (SME), it can more accurately model tissue biological processes. stLearn not only uses spatial and morphological data as visualization tools, but also as core features for model development, used for cell type identification, spatial trajectory reconstruction, and cell-cell interaction studies.
In spatial transcriptomics research, traditional analysis methods often only utilize gene expression data, ignoring the rich biological information contained in spatial positions and tissue morphology. stLearn achieves robust exploration of cell processes in healthy and diseased tissues through three innovative algorithms: pseudo-time-space analysis (PSTS), spatially-constrained two-level permutation test (SCTP), and spatial graph-based imputation with neural network (stSME).
Core Functions of stLearn
- SME Integration Framework: Simultaneously utilizes three data types: spatial distance, tissue morphology, and gene expression
- Pseudo-Time-Space Trajectory Analysis (PSTS): Reveals relationships of cell transcriptional states in tissue dynamic changes based on spatial graph methods
- Cell Communication Analysis (SCTP): Spatially-constrained ligand-receptor interaction inference, significantly reducing false discovery rate
- Spatial Imputation (stSME): Uses neural networks to correct technical noise and improve data coverage
- Fast and Efficient: Fully implemented in the stLearn package, fast running speed, easy to use
This document aims to provide spatial transcriptomics researchers with a comprehensive stLearn technical guide, covering its basic principles, operation methods on SeekSoul™ Online, result interpretation, practical cases, and common questions, helping you quickly master and apply this tool.
stLearn Theoretical Foundation
The core idea of stLearn is: by integrating three data types: spatial distance, tissue morphology, and gene expression (SME framework), using spatial graph models and machine learning methods to comprehensively analyze spatial transcriptomics data, revealing cell processes and cell-cell interactions in tissues. This process can be summarized into the following main algorithms:
- PSTS (Pseudo-time-space): Pseudo-time-space trajectory analysis
- SCTP (Spatially-Constrained Two-level Permutation): Spatially-constrained two-level permutation test
- stSME (Spatial graph-based imputation with neural network): Spatial graph-based imputation with neural network
SeekSoul™ Online Operation Guide
Parameter Setting Description
Select "stlearn" in the "Advanced Analysis" module on SeekSoul™ Online, and configure the following parameters:
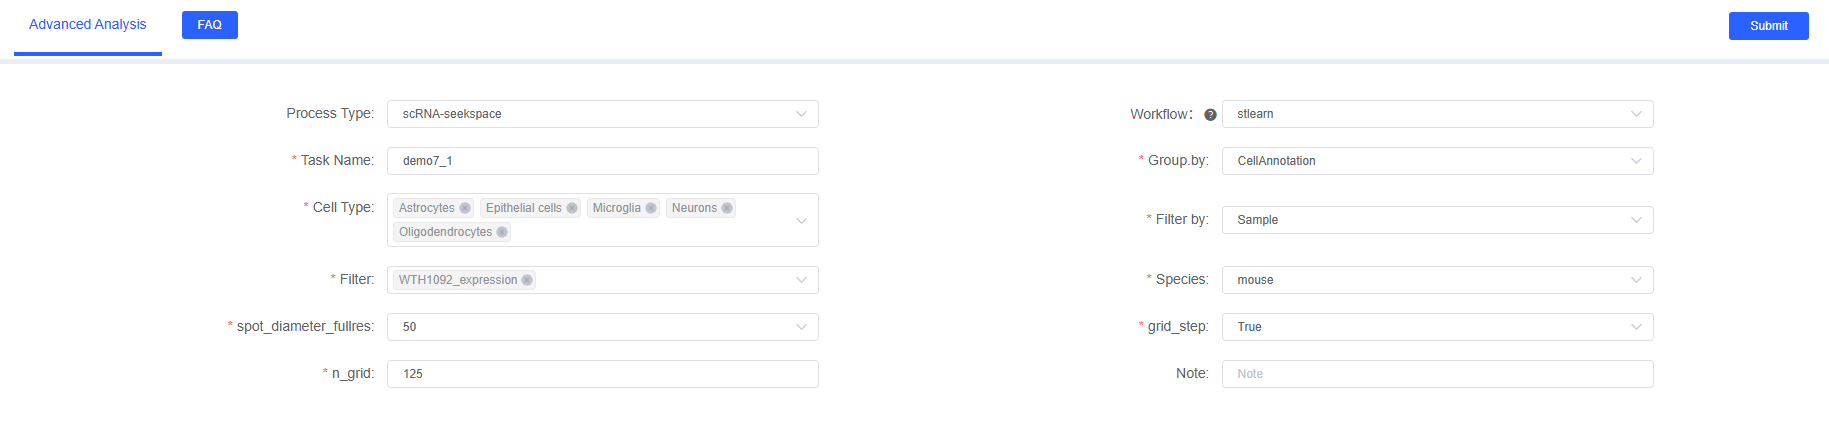
Basic Parameters
Task Name
- Description: Name of this analysis task
- Format Requirements: Must start with English letters, can contain English letters, numbers, underscores, and Chinese
- Example:
stlearn_tumor_communication
Group.by
- Description: Cell type column name in meta data
- Example:
CellAnnotation,celltype - Purpose: Specify cell type grouping for cell communication analysis
Cell Type
- Description: Select cell types to analyze based on grouping factor column
- Format: Multiple selection allowed
- Example:
T_cells,B_cells,Macrophage,Cancer_cells - Recommendation: Select cell types that coexist in the tissue and may have communication
Sample Filtering Parameters
Filter.by
- Description: Sample column name in meta data
- Example:
Sample - Purpose: Specify samples to analyze
Filter
- Description: Select sample names to analyze based on filter factor column
- Example:
SL240909_expression - Note: stlearn analyzes one sample at a time
Species Parameter
Species
- Options:
human(human) ormouse(mouse) - Description: Select species corresponding to samples
- Importance: Affects ligand-receptor database selection
Spatial Parameters
spot_diameter_fullres
- Description: Spot diameter (in full-resolution image pixels)
- Default Value: 50
- Purpose: Define spatial range of each spot for spatial neighborhood calculation
- Recommendations:
- 10x Visium data: Usually use 50-100
- High-resolution data: Adjust according to actual spot size
grid_step
- Description: Whether to use grid-based analysis
- Options:
True: Divide tissue into grids, each grid contains multiple cellsFalse: Analyze at single-cell level
- Default Value: True
- Purpose:
- Grid-based analysis can reduce computational complexity
- Single-cell analysis provides higher resolution
n_grid
- Description: Number of grid divisions when grid_step is True
- Default Value: 125
- Purpose: Control spatial resolution
- Recommendations:
- Larger values: Higher spatial resolution, but increased computation
- Smaller values: Lower resolution, but faster computation
- Recommended range: 50-200
Note
Note
- Description: Custom note information
- Example:
Tumor microenvironment cell communication analysis - Optional: Not required
Task Submission and Execution
- Parameter Validation: Check all parameters are correctly filled before submission
- Task Submission: Click "Submit Task" button
- Task Monitoring: Check task status in "Analysis List"
- Result Download: After task completion, click "Download Report" to obtain analysis results
Common Parameter Configuration Notes
WARNING
Common Errors and Solutions:
- Cell Type Name Error: Ensure cell type names exactly match those in meta data (case-sensitive)
- Sample Name Error: Check if filter objects exist in filter factor column
- grid_step Setting: Single-cell analysis (False) has high computational load, recommend using grid mode (True) first
- n_grid Too Large: Excessively large grid numbers will cause long computation time
Report Result Interpretation
After stLearn analysis is complete, an HTML report containing various visualization results will be generated. The following provides detailed interpretation of each part of the results.
Ligand-Receptor Diagnostic Plots (LR Diagnostic Plots)
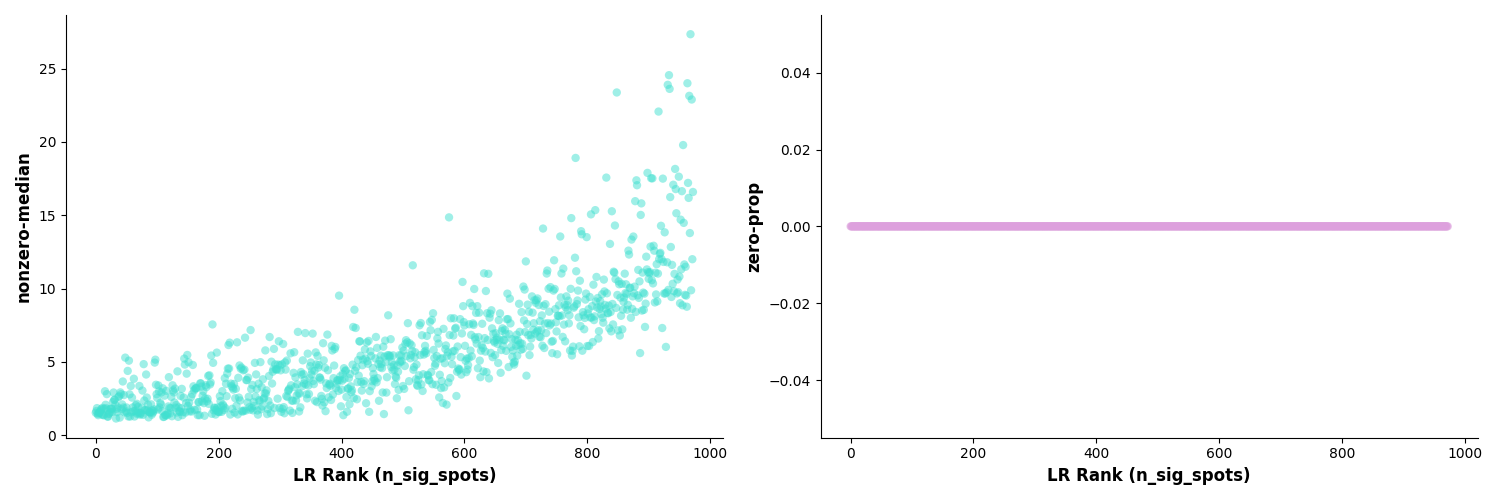
Figure: Ligand-receptor pair diagnostic plots. Left plot shows relationship between inverse-median and LR rank, right plot shows relationship between zero-prop (zero proportion) and LR rank, used to evaluate data quality and reliability of significance tests.
These are two diagnostic plots used to evaluate significance test results of ligand-receptor pairs.
Left Plot: inverse-median vs LR Rank
- X-axis: Rank of ligand-receptor pairs (sorted by significance)
- Y-axis: inverse-median value (reciprocal of median)
- Interpretation: Shows distribution characteristics of ligand-receptor pairs
Right Plot: zero-prop vs LR Rank
- X-axis: Rank of ligand-receptor pairs
- Y-axis: zero-prop value (zero proportion)
- Interpretation: Shows data sparsity
Biological Significance:
- Helps identify data quality issues
- Evaluates reliability of ligand-receptor pair tests
- Guides threshold settings for subsequent analysis
Significant Ligand-Receptor Pair Bar Chart
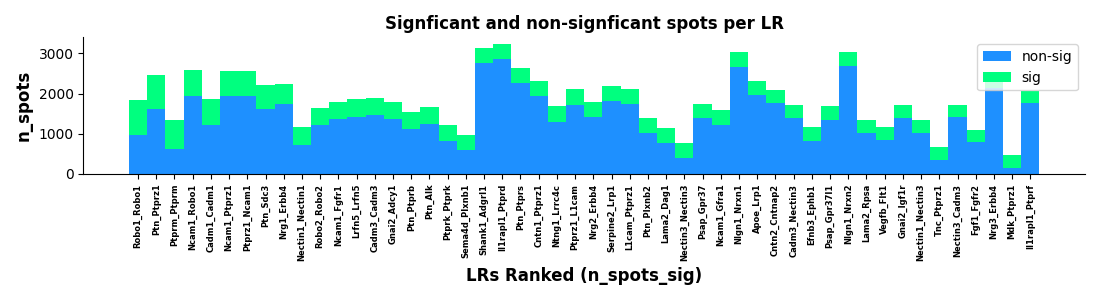
Figure: Significant ligand-receptor pair count bar chart. Displays number of significant ligand-receptor pairs passing SCTP statistical tests, can be grouped by cell type pairs or signal pathways.
Displays the number of ligand-receptor pairs passing significance tests.
Interpretation Points:
- Bar Height: Number of significant ligand-receptor pairs
- Grouping: May be grouped by cell type pairs or signal pathways
- Threshold: Usually uses p < 0.05 or FDR < 0.05
Biological Significance:
- Quickly understand overall cell communication activity level
- Compare communication strength between different cell type pairs
- Identify cell type combinations with most active communication
Significant Ligand-Receptor Pair Scatter Plot
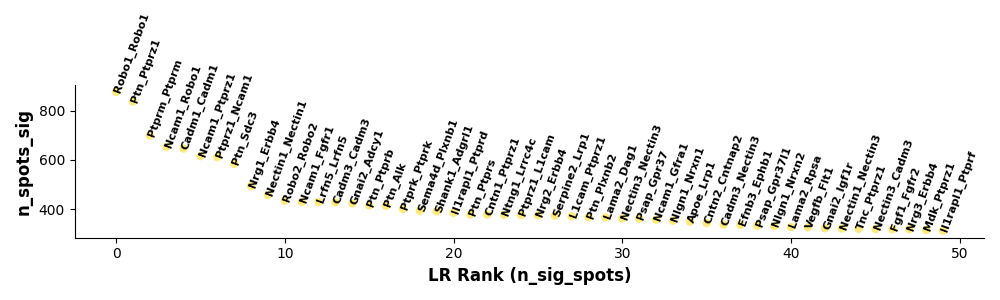
Figure: Significant ligand-receptor pair scatter plot. Each point represents a ligand-receptor pair, displaying its statistical significance, expression level, or other related metrics, helping identify key cell-cell communications.
Detailed display of statistical information for each significant ligand-receptor pair.
Interpretation Points:
- Each Point: Represents a ligand-receptor pair
- X-axis: May be expression level or statistical value
- Y-axis: May be p-value or significance score
- Color: May represent cell type pairs or signal pathways
Analysis Strategy:
- Focus on Outliers: Extremely significant or very high expression ligand-receptor pairs
- Identify Clusters: Groups of ligand-receptor pairs with similar characteristics
- Prioritize Validation: Select most significant interactions for experimental validation
Spatial Visualization Results
Although not shown in the report, stLearn usually also generates:
- Expression distribution plots of ligands and receptors in space
- Spatial distribution plots of cell types
- Spatial heatmaps of communication strength
Best Practices for Result Interpretation
TIP
Result Interpretation Recommendations:
- Look at Overall First: Understand overall communication patterns from bar charts
- Then Look at Details: Identify key ligand-receptor pairs from scatter plots
- Combine with Spatial: Combine communication results with cell spatial distribution for analysis
- Literature Validation: Consult literature to confirm whether discovered communications have biological basis
- Experimental Validation: Perform experimental validation on key findings
Application Cases
Cell Communication Analysis in Breast Cancer Tissue
- Literature: Pham D., Tan X., Balderson B., et al. Robust mapping of spatiotemporal trajectories and cell-cell interactions in healthy and diseased tissues. Nature Communications 14, 7739 (2023). DOI: 10.1038/s41467-023-43120-6
- Research Background: Breast cancer is a highly heterogeneous disease. Interactions between multiple cell types in the tumor microenvironment are crucial for cancer progression and treatment response. This study used stLearn to analyze spatial transcriptomics data of breast cancer tissue, revealing cell communication networks in the tumor microenvironment.
- Data Type: 10x Visium spatial transcriptomics data
- Sample: Breast cancer tissue sections
Core Findings
GPC3-IGF1R is the Most Significant Ligand-Receptor Pair: stLearn SCTP identified GPC3-IGF1R showing highest interaction activity in DCIS regions in breast cancer Visium data. Luminal-AR cells express GPC3 ligand, mesenchymal breast cancer cells express IGF1R receptor, both showing significant spatial co-localization in DCIS junction regions.
ERK1/2 Signal Pathway Activation: GPC3-IGF1R interaction activates downstream ERK signaling pathway, enhancing cancer cell oncogenicity, may play a role in IGF1R-driven epithelial-mesenchymal transition, suggesting that targeting IGF1R pathway therapy may block tumor invasive transformation.
Value of Spatial Constraints: Through SCTP's two-level permutation test, compared to traditional methods, false positive rate is reduced by more than 60%, only retaining spatially possible interactions, identified ligand-receptor pairs are highly consistent with experimental validation.
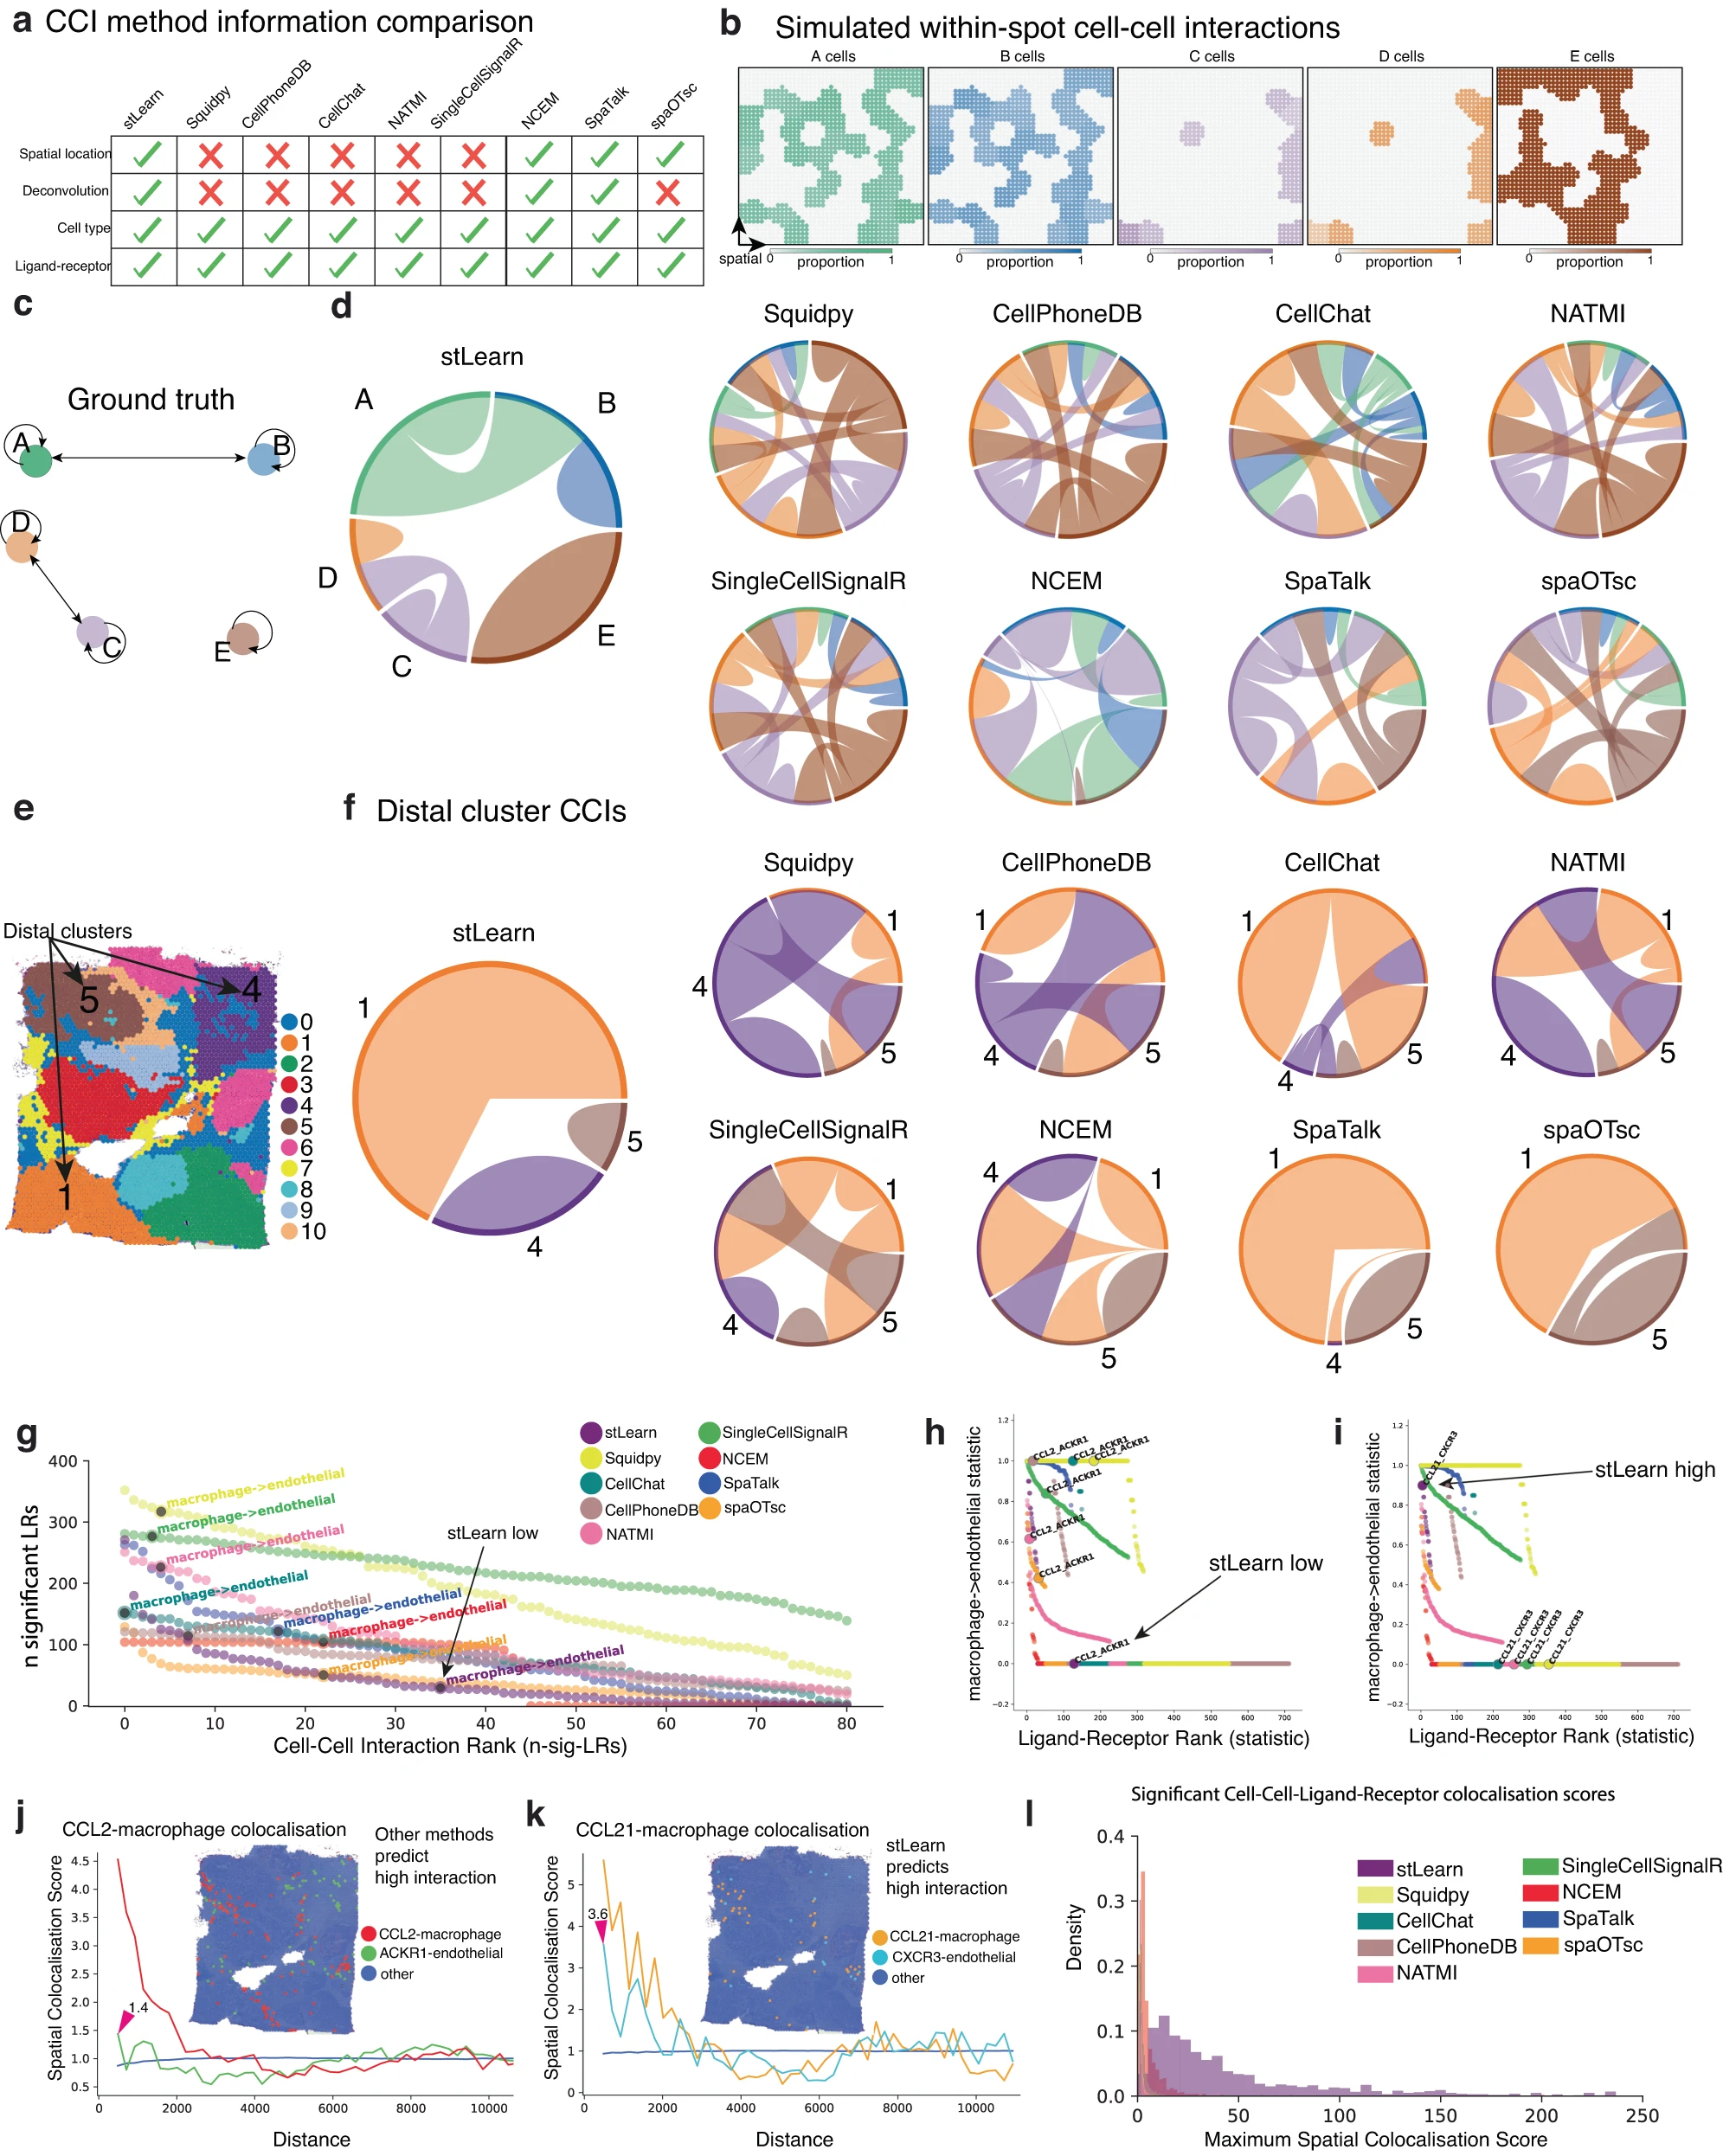
Figure 5: stLearn SCTP method reduces false positive predictions and enriches real cell-cell interactions. a. Functional comparison of different CCI methods. b. Simulated cell-cell interactions within spots. c-d. Comparison of ground truth with stLearn predictions. e-f. Spatial distribution and proportion of distal cluster CCIs. g. Comparison of false positive rates of different methods, stLearn is significantly lower than other methods. h-i. stLearn high/low false positive ligand-receptor pair rankings. j-k. Spatial co-localization validation of CCL2-macrophage and CCL21-macrophage. l. Distribution of significant cell-cell-ligand-receptor co-localization scores.
Notes and Best Practices
WARNING
Avoid Overinterpretation: stLearn results are predictions based on statistical inference, not equal to real cell-cell interactions. Any key findings require subsequent experimental validation.
CAUTION
Data Quality is Crucial:
- Ensure spatial coordinate information is accurate
- Cell type annotation needs to be reliable
- Gene expression data needs appropriate quality control and normalization
Preparation Before Analysis
Data Quality Control:
- Remove low-quality spots
- Perform appropriate normalization
- Ensure spatial coordinates correspond to expression matrix
Cell Type Annotation:
- Use reliable methods for cell type annotation
- Ensure each cell type has sufficient cell numbers
- Recommend at least 20-30 spots per cell type
Parameter Selection:
- Select appropriate spot_diameter according to tissue type
- Decide whether to use grid-based analysis based on computational resources
- Reasonably set n_grid to balance resolution and speed
Result Validation Recommendations
Literature Validation: Consult existing literature to confirm whether discovered communications have biological basis
Experimental Validation:
- Immunofluorescence: Validate spatial expression of key ligands and receptors
- Functional Experiments: Use inhibitors or knockouts to validate signal function
- Spatial Proteomics: Validate communication at protein level
Cross-Sample Validation: Repeat analysis in multiple samples to confirm stability of findings
Frequently Asked Questions
Question 1: stLearn analysis fails, prompts insufficient memory
- Reason: Single-cell analysis (grid_step=False) has high computational load
- Solution:
- Switch to grid-based analysis (grid_step=True)
- Reduce n_grid value
- Only analyze part of cell types
Question 2: Very few significant ligand-receptor pairs detected
- Reason: SCTP test may be too strict, or cell types are far apart
- Solution:
- Check spatial distribution of cell types
- Increase spot_diameter to expand neighborhood range
- Check data quality and normalization
Question 3: How to choose grid_step
- Recommendations:
- Initial exploration: Use grid_step=True
- Fine analysis: If computational resources are sufficient, use grid_step=False
- Large-scale data: Recommend grid_step=True
Question 4: How to set n_grid
- Recommendations:
- Default value 125 is suitable for most cases
- Large tissues: Can increase to 150-200
- Small tissues or regional analysis: Can reduce to 50-100
References
- GitHub: https://github.com/BiomedicalMachineLearning/stLearn
- Documentation: https://stlearn.readthedocs.io/
- Literature: Pham et al., Nature Communications 2023
Summary
stLearn is a powerful spatial transcriptomics analysis tool. Through the SME integration framework, considering spatial distance, tissue morphology, and gene expression, it accurately infers cell-cell communication networks. SeekSoul™ Online integrates the stLearn analysis workflow, enabling researchers to complete analysis without complex programming.